See your money’s other lives.
One amount, one starting month — then two futures, side by side. PastFi replays real monthly history across stocks and real estate, so you can compare what actually would have happened.
Run my comparison →No signup required for the demo
Set up
A scenario in about 60 seconds.
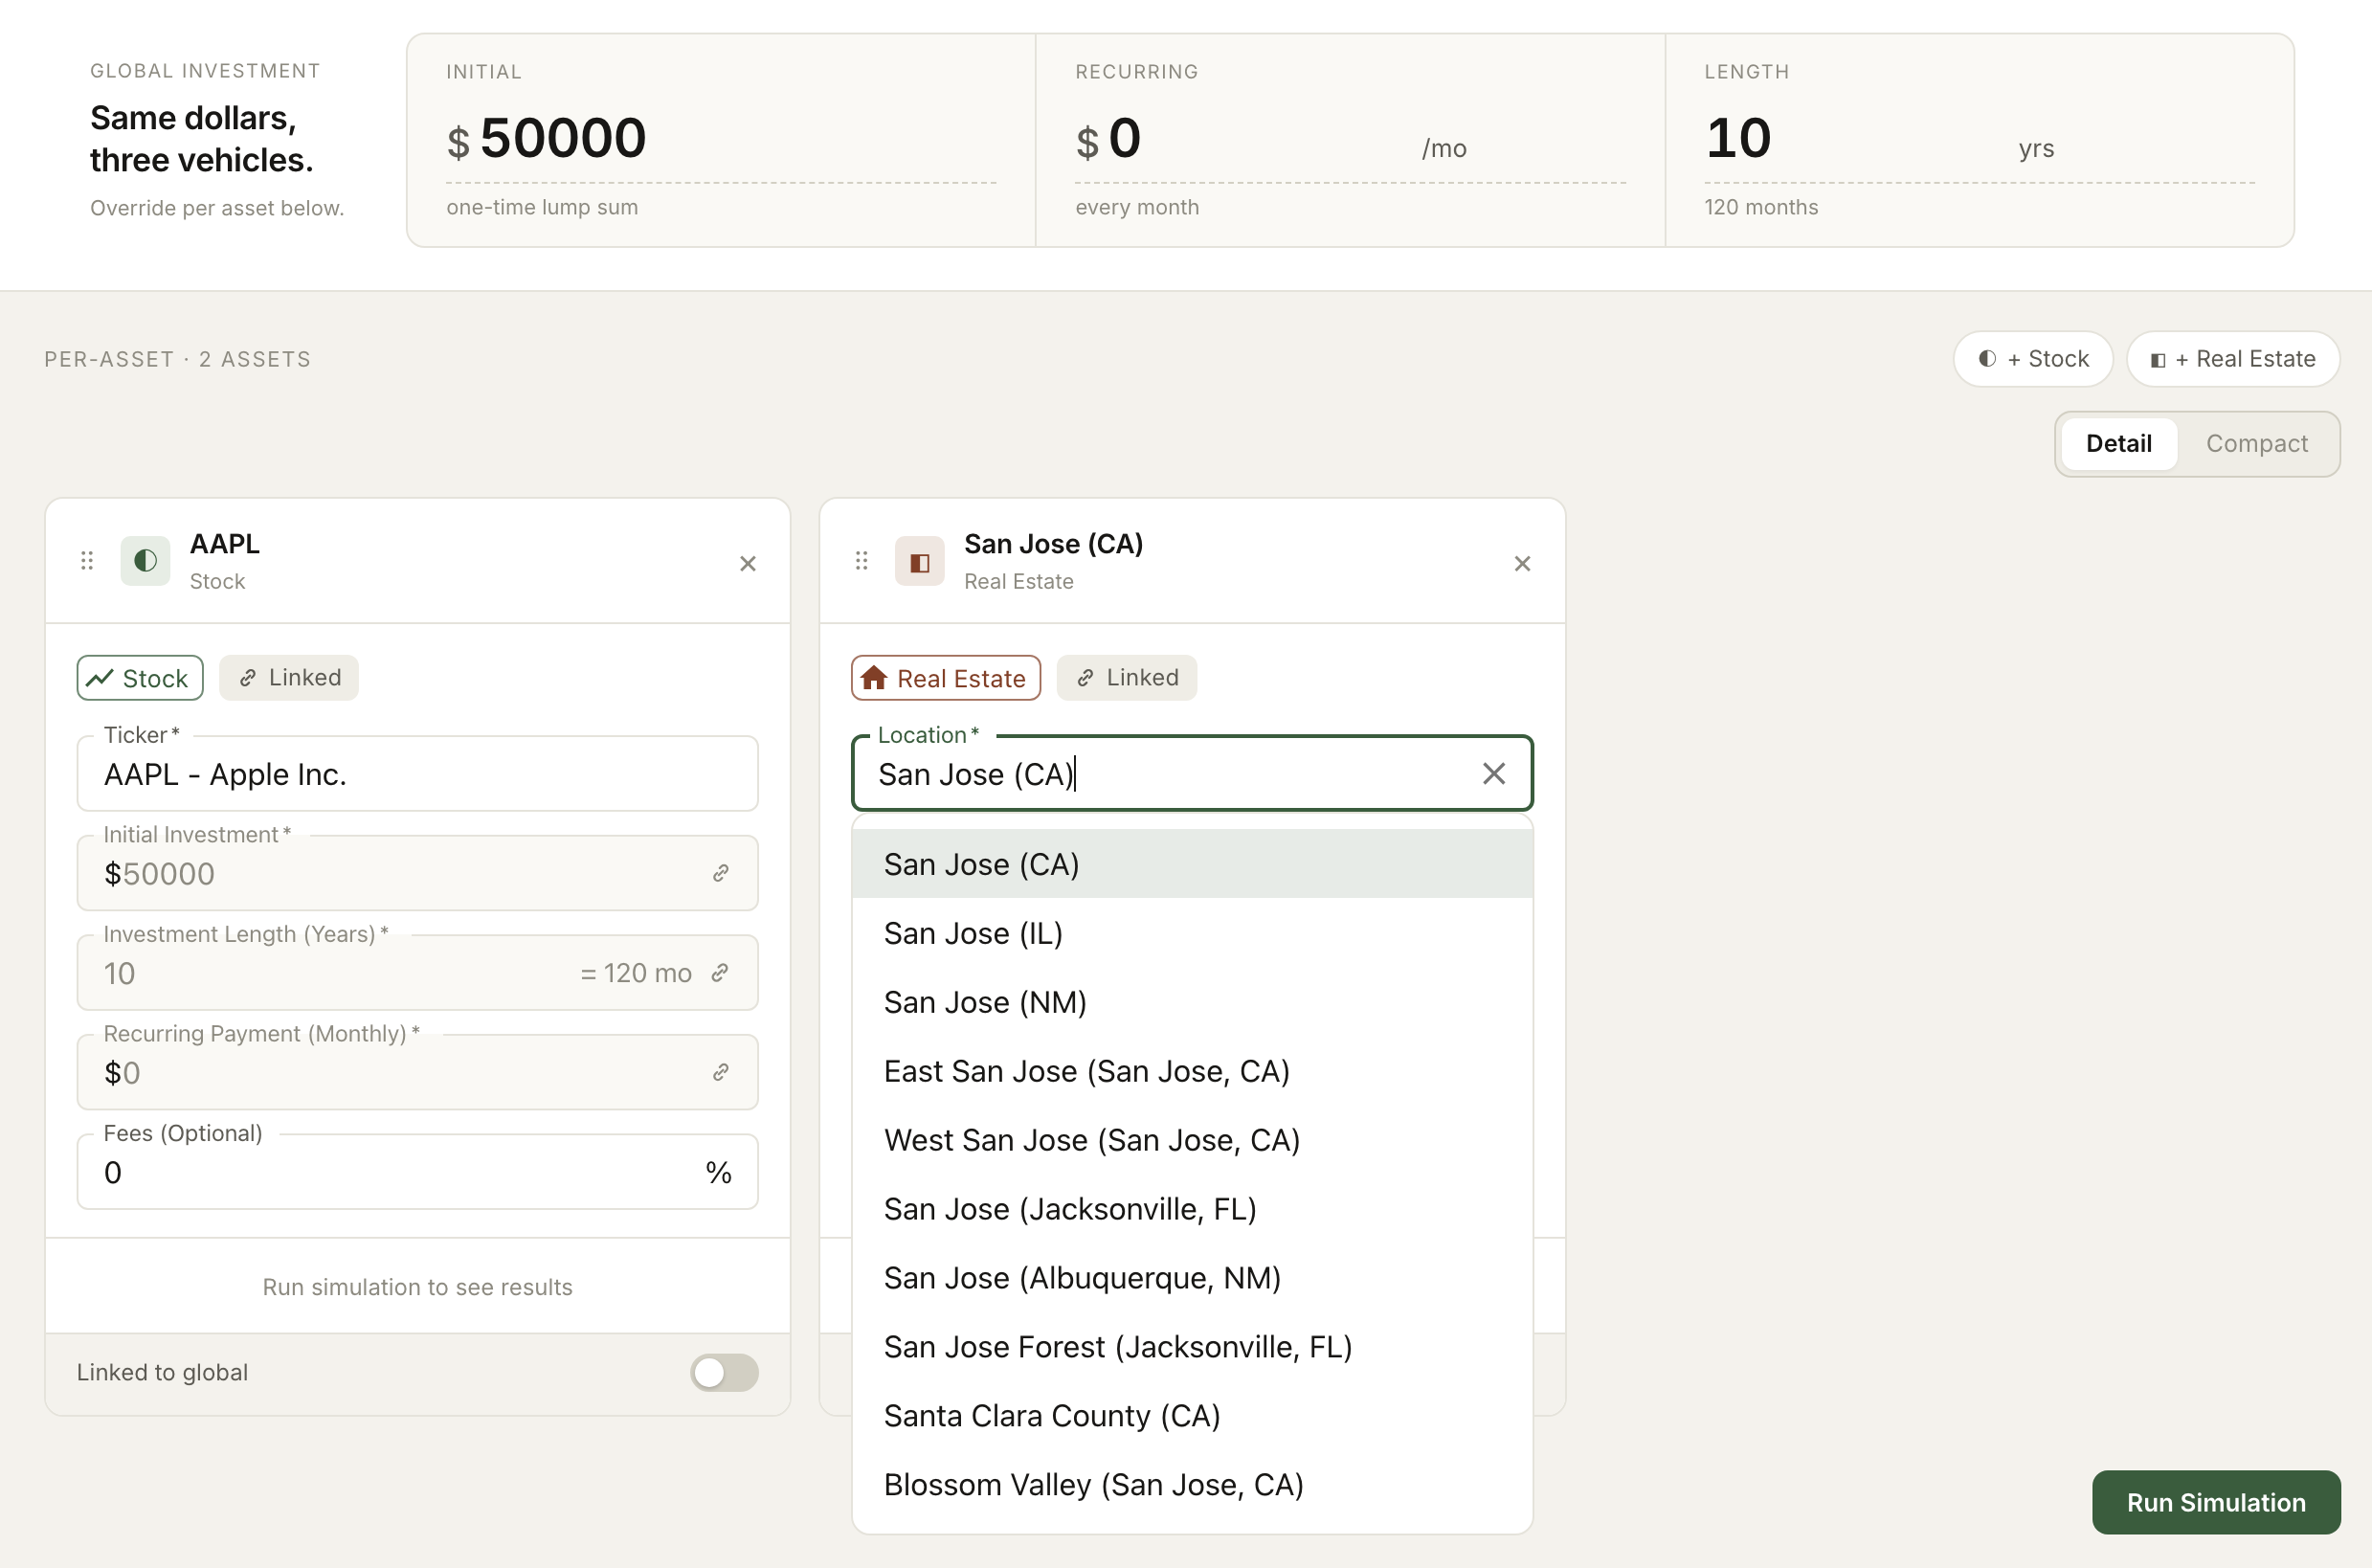
Add the assets you want to weigh — stocks by ticker, real estate by region — set a starting amount and a recurring contribution, and pick a horizon. No spreadsheets, no account hookups.
Compare
Every asset on one chart.
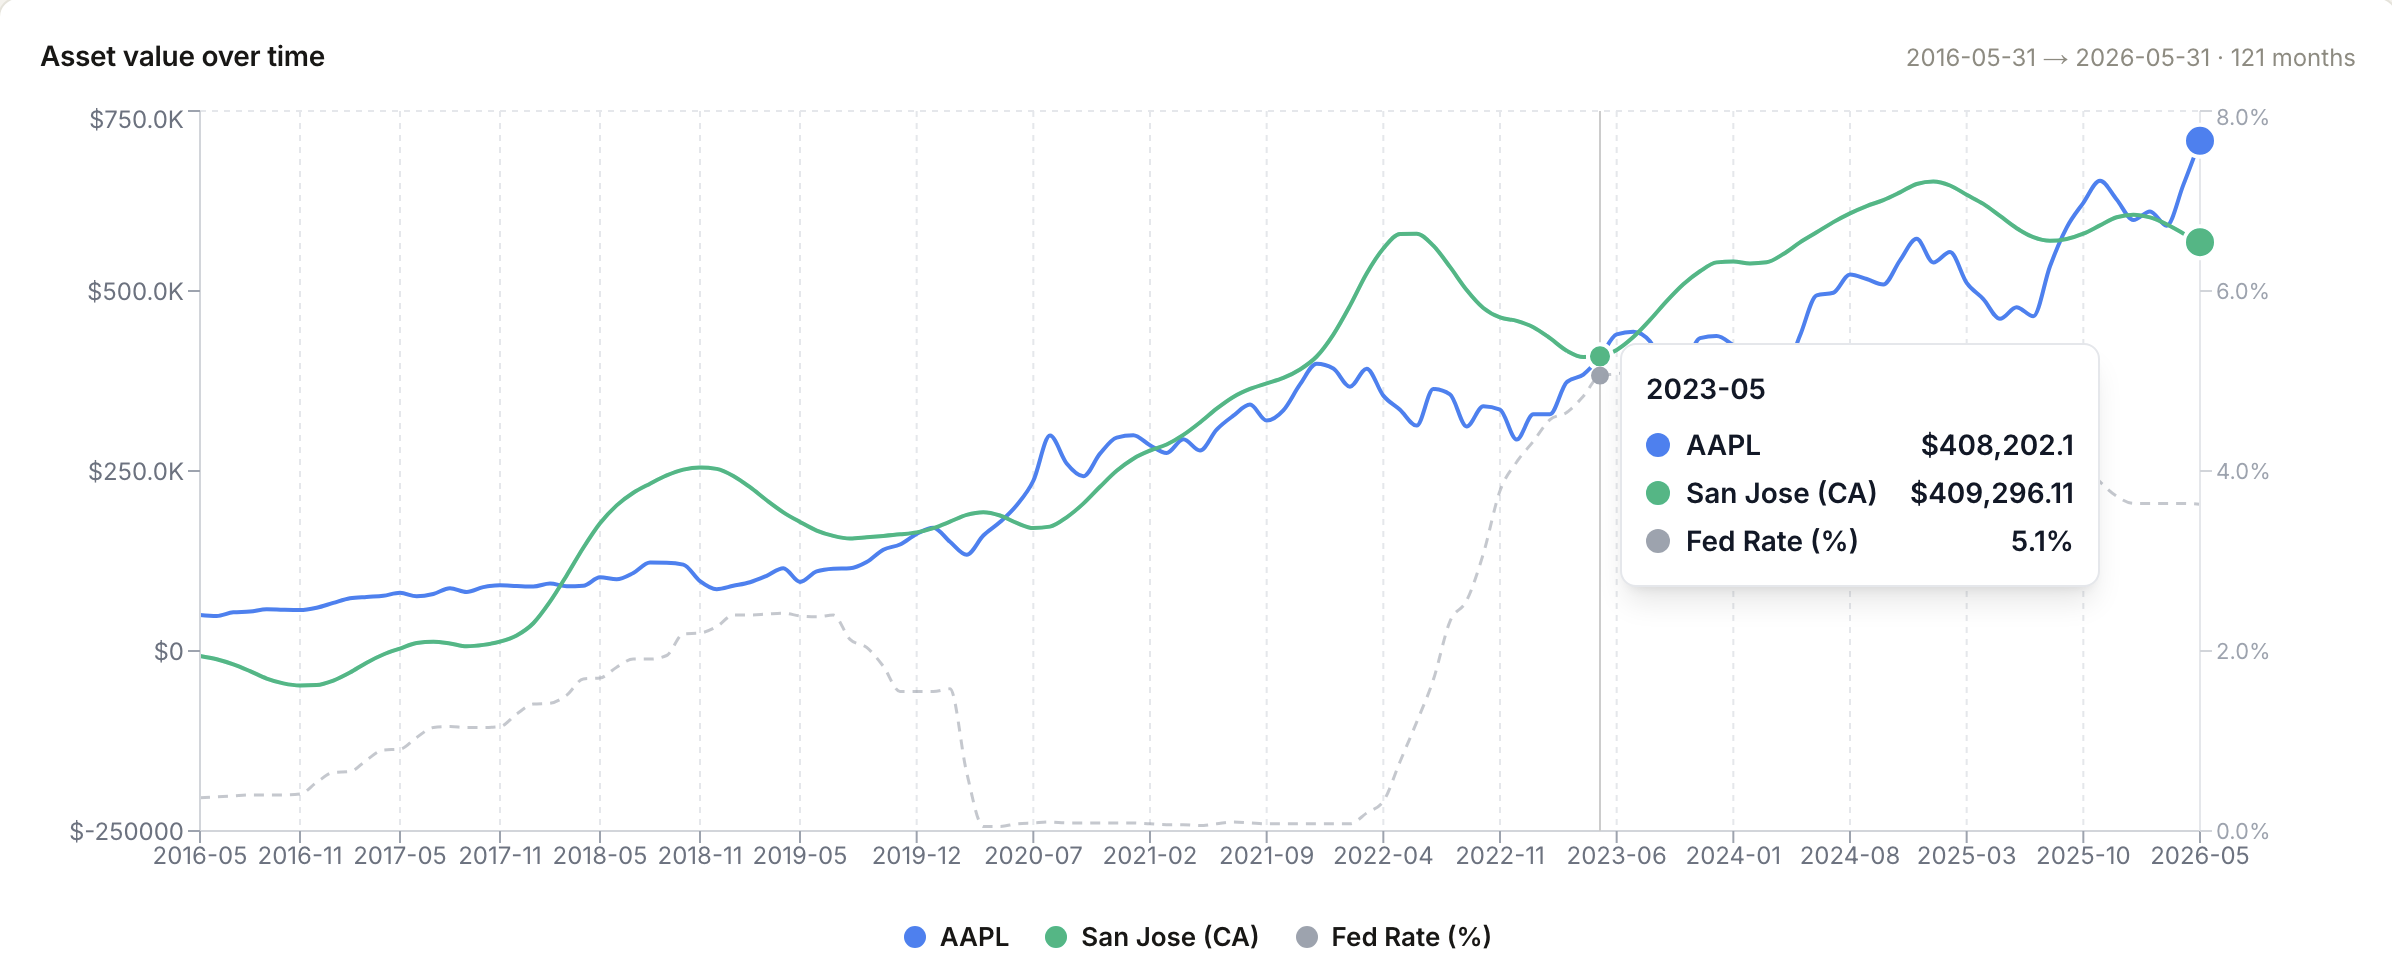
Stocks and real estate share a single axis. Scrub the month slider to read every asset's balance at any point in the history, side by side.
Verify
Every assumption is yours — per asset.
Each asset card is linked to your global inputs or set to Override, with its own returns, fees, and mortgage rate. Change an input and a Re-simulate prompt keeps the numbers in sync — open Summary or Detail to trace the figures behind each line.
See the full methodology →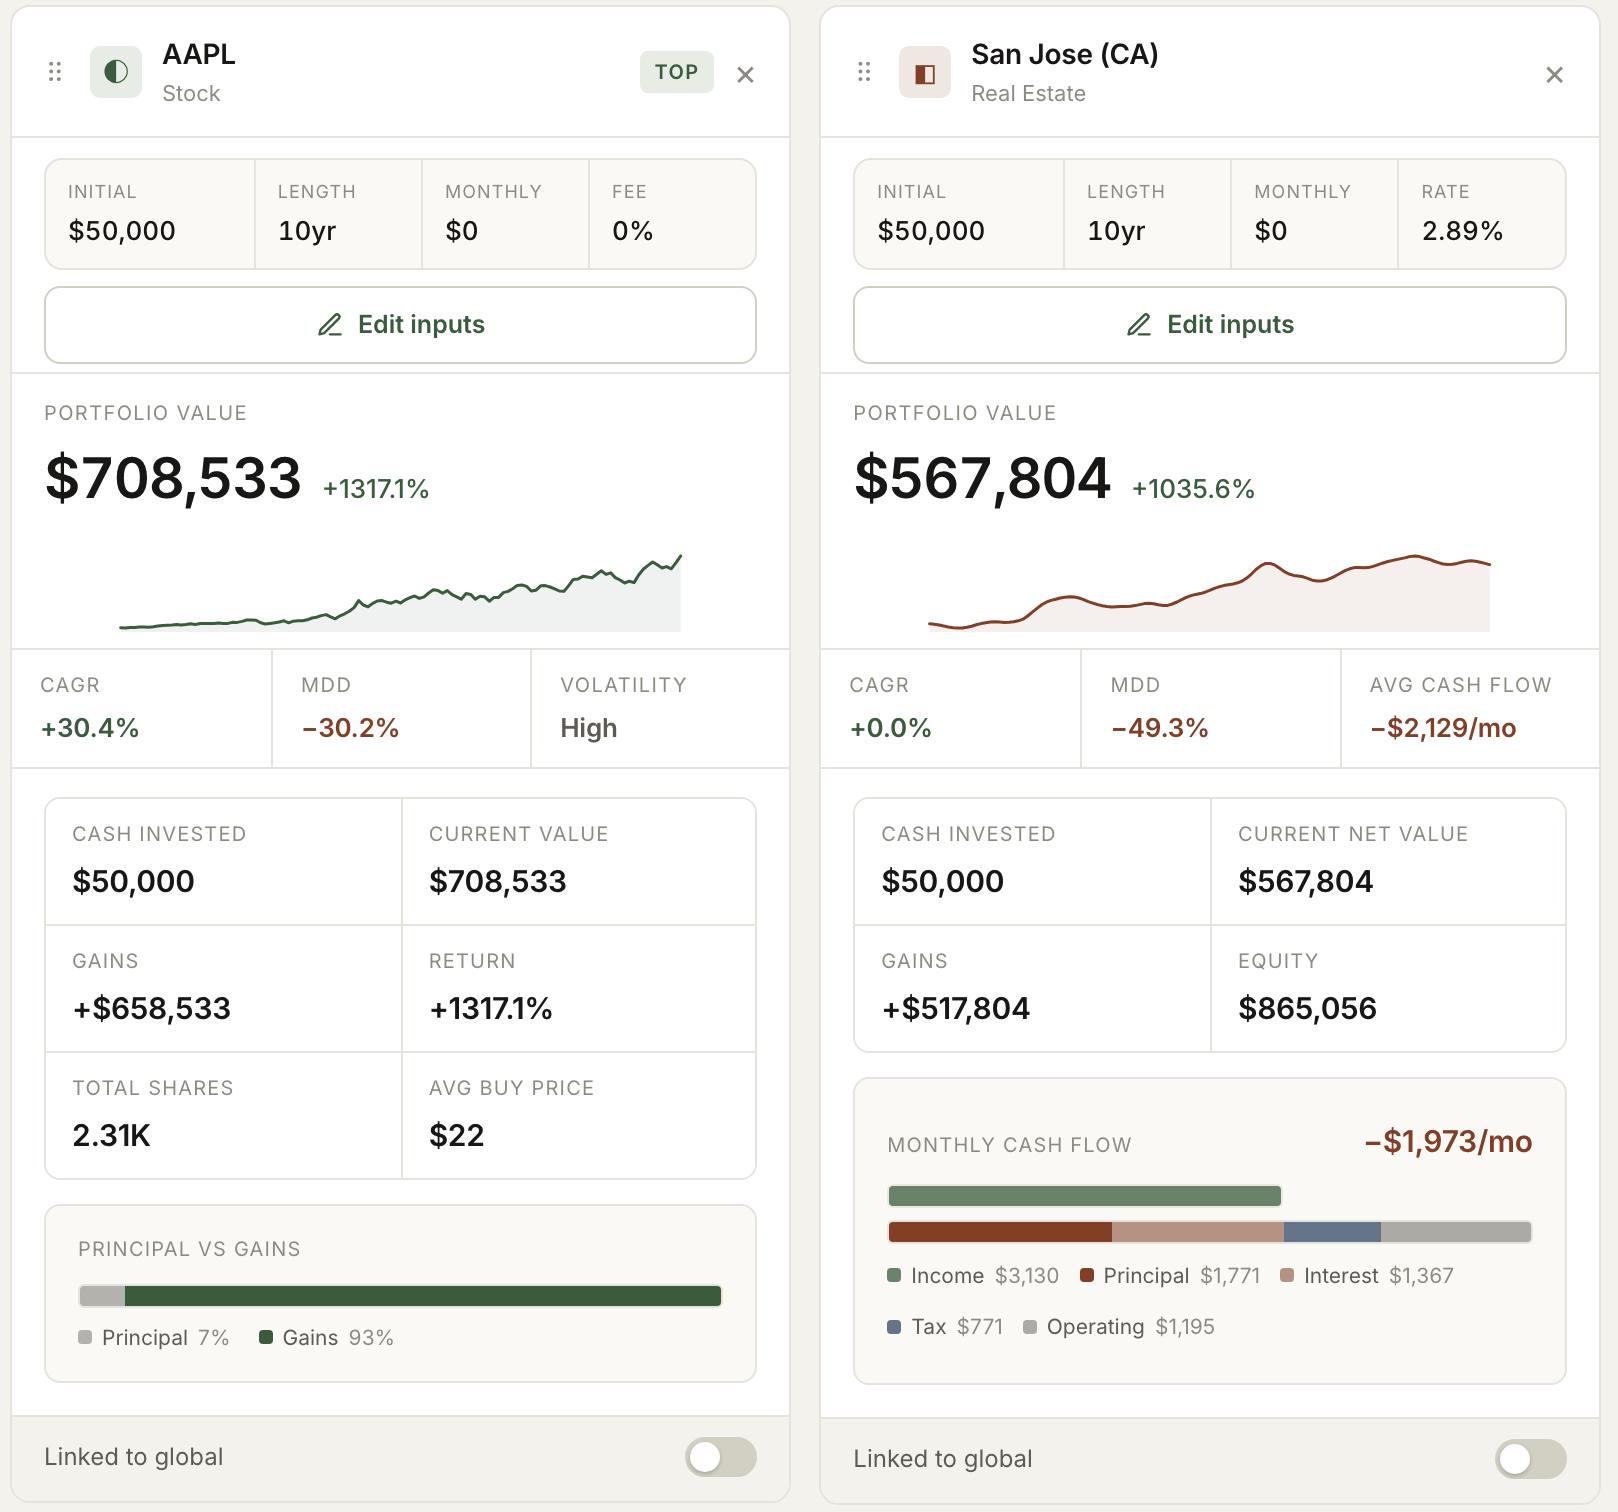
The basis
Built on real history, not projections.
Every figure traces back to a source series and a stated assumption.
Equities
Real ticker history, adjusted close, dollar-cost averaged.
Real estate
Zillow ZHVI prices and ZORI rents, standard amortization, vacancy.
Fees
Declared up front, never buried in the return.
Rates
The Fed funds rate, carried as a reference line.
Metrics
CAGR and max drawdown on every asset.
Inside the simulator
Everything you need to ask “what if?”
Two asset classes
Stocks and real estate — modeled side by side on a single axis.
Recurring contributions
A starting amount plus recurring contributions over any horizon.
Parallel scenarios
Spin up scenarios in tabs and compare counterfactuals without losing your place.
Ticker & region search
Search any equity ticker or U.S. region to anchor an asset to a real market.
Month-by-month scrubber
Drag the slider to read every asset's balance at any month across the history.
Per-asset Override
Link a card to your global inputs, or override its returns, fees, and mortgage rate. Nothing is hidden.